|
By: Sinan AlKhatib  Introduction Before deciding to watch a movie, I almost always check movie ratings on IMDb-Internet Movie Database. I don’t check movie reviews, at least not before I actually watch the movie, avoiding any and all spoilers. There are many blogs and articles claiming that IMDB ratings are biased, maybe even inaccurate. To be honest, after reading these claims, I began to notice that I just don’t like most movies with high ratings. Did these claims play with my head? I, for the most part, am impartial to IMDb, and enjoy using it to get insights about new and old cinema alike. Nevertheless, I needed to explore these presumably false theories that somehow IMDb was aggrandizing movies that are really just run-of-the-mill films. I decided to compare it with the renowned and popular movie rating website: Metacritic. In this article, I will statistically investigate both movie rating websites and share the results with you. I will use data for over 3000 movies in which I web scraped from the IMDb website on December 25th, 2018. I will examine the data obtained to find out which website has more reliable ratings and determine which website is indeed reflects the quality of the movies. To do so I will look for the normality of the ratings distribution as my selected criterion. The data contains the name of the movie, the year, the IMDb score (converted to 100-points scale), the Metacritic score, and the number of votes for each movie. How to decide on the best? If you are like me, most movies I have watched were average, a few were outstanding, and few were extremely bad. Average movies are ones you have watched and have a neutral stance on and most probably, they are unrememberable and not far from insignificant. Outstanding movies are the ones that you have watched more than once—the ones that leave a significant impression on you. Then, there are the bad movies, so bad that you can’t finish them or just regret the time spent watching them. Do you think that most of the movies you watched in the last, let’s say, five years were average? Websites with better ratings should have the pattern of normal distribution. A normal distribution of values is one in which most of value points are relatively similar, occurring within a small range of values, with fewer extremes on the higher and lower ends of the range of data. In general, this is what normal distribution looks like: 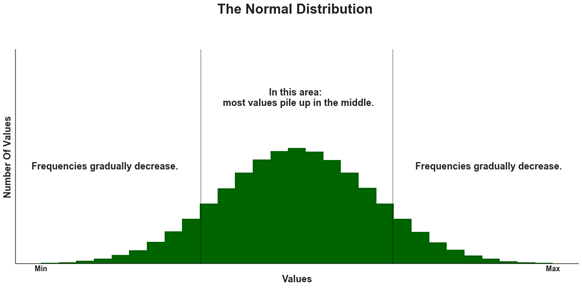 For movie ratings, a normal distribution is when there are a few low ratings, a lot of average ones, and a few high ratings. I believe that movie ratings do express movie quality and that’s why, ideally, we should see most of the ratings lying closer to average, the middle area in the graph below. 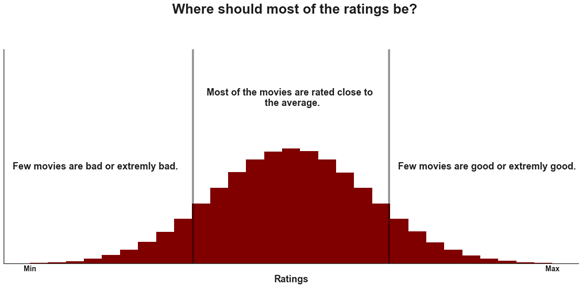 The taller the bar in the above figure, the greater the number of movies with that rating in the interval. A perfect normal distribution is more of a theoretical idea than a common reality. If we examine one movie rating, we will find that most of the ratings would be either high, average, or low. That is because majority of the people would generally agree that the movie is either good, average, or bad. That said, if we collect a big sample of movies rating, we should find a distribution that at least closer to a normal distribution. If not, we may question the accuracy of the ratings process. This is what we are going to find out in the below section. Analysis Let’s first read the data and examine the first 3 rows:
When I web scrapped the data, I have converted IMDb ratings to a 0-100 scale similar to Metacritic ratings scale so there is a consistency between both scales and therefore rating could be faultlessly compared. -. Now we will find how many movies were rated in every year: 2018 180 2017 184 2016 188 2015 180 2014 180 2013 180 2012 196 2011 180 2010 184 2009 176 2008 184 2007 176 2006 180 2005 164 2004 192 2003 188 2002 192 2001 180 2000 196 The number of movies per year are within the range of 164-196, so it makes sense not to exclude the ratings for any of the years. On average, there are 183 movies per year. Before we dive into the data and examine the distribution, on a 0 to 100 scale, a good movie is somewhere between 70 and 100, an average is between 30 and 70, and a bad movie is somewhere between 0 and 30. This distinction may not be of most scientific accuracy, but that’s how Fandango, another movie rating site, classify movies, so in this case we will use the same logic. I will now generate two histograms, one for IMDb and the other for Metacritic ratings: 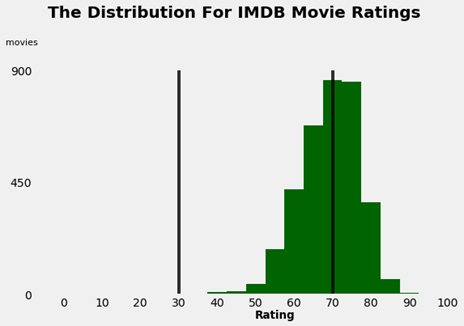 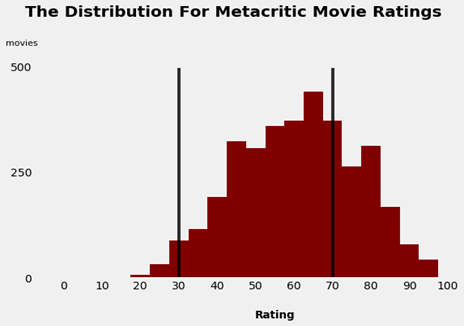 Starting with the IMDb histogram, we can see that most ratings are between 56 and 85. Fewer ratings are greater than 85 and even fewer ratings smaller than 56. We also note that there are no movies rated 41 or less. We can confirm this by generating a grouped frequency distribution table for IMDb ratings: (40.95, 45.9] 8 (45.9, 50.8] 20 (50.8, 55.7] 76 (55.7, 60.6] 160 (60.6, 65.5] 488 (65.5, 70.4] 772 (70.4, 75.3] 812 (75.3, 80.2] 840 (80.2, 85.1] 272 (85.1, 90.0] 32 This indicates that rates tend to be high. The average of rates at IMDb is approximately 71. We call such distributions where most values pile up toward the right ‘Left Skewed Distributions’. Unexpectedly most of the data is relatively around the mean (the average. Earlier we predicted that most of the data would be between 30 and 70. The distribution of Metacritic (METASCORE) ratings resemble almost a normal distribution, where most of the ratings are near the average. The average is approximately 63. Most of the ratings are between 32 and 92. Let’s confirm this by looking at the grouped frequency distribution table: (23.923, 31.6] 72 (31.6, 39.2] 172 (39.2, 46.8] 308 (46.8, 54.4] 516 (54.4, 62.0] 556 (62.0, 69.6] 616 (69.6, 77.2] 552 (77.2, 84.8] 396 (84.8, 92.4] 208 (92.4, 100.0] 84 Again, we shouldn’t expect a perfect normal distribution, but this is certainly closer to our theoretical assumption compared to IMDb. To have a better look on both distributions, let’s generate a comparative graph: 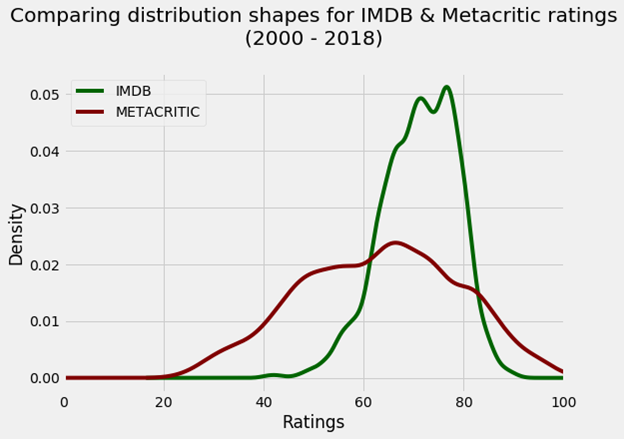 It’s clearer that the IMDb’s distribution is extremely skewed toward the higher part of the average ratings, while the Metacritic’s METASCORE ratings have nearly balanced distribution. Recommendation and last few words I recommend checking the Metacritic’s METASCORE whenever you are looking for an accurate movie rating. The good news is that the Metacritic’s METASCORE is available on the IMDb website for most of the movies. That said, what might be the reason for that left skewed distribution in the IMDb? One reason might be that most users tend to give 100 for movies they like and very low for movies they don’t like, or don’t even bother to rate such movies. The METASCORE is a weighted average of reviews from top critics and publications for a given movie, TV show, video game, or album as declared by Metacritic website. This would explain the better results we reached. The downside of Metacritic is that you can’t easily find ratings for unpopular or less mainstream movies that appeared prior to 1999. Also, most non-English movies are not even listed on Metacritic, but can be found on IMDb. You can find the codes used to generate the tables and the graphs in the Python Code section below. Have fun watching movies 😊 Python Code Read the data
Number of movies per year
IMDB Histogram
Metacritic Histogram
Mean, Median, and Mode for both IMDB and Metacritic
Grouped Frequency Tables
Comparing Distribution Shapes
1 Comment
|