|
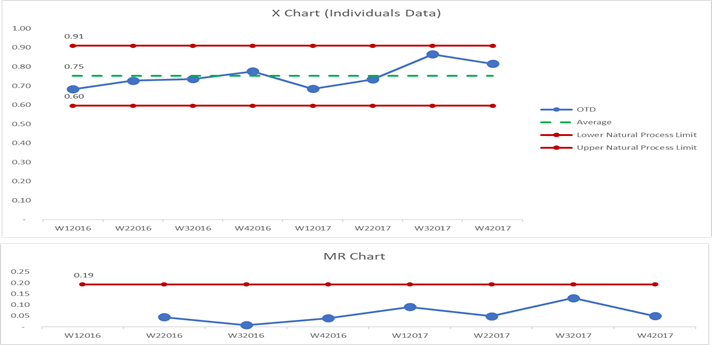
Process Behavior Chart (PBC) Process behavior chart (PBC) helps in examining the data generated from a process to see if it is predictable or unpredictable. Every time we do work – be it in services, manufacturing or even personal, the outcomes will normally vary. For example, let us say that you drive to your office every day and your office is 10 miles away from your home. How long will it take you to arrive to the office? Will you be able to arrive in thirty minutes every day? Do you have a target to arrive in thirty minutes? Does it take you more than an hour in some days? Process behavior chart aka statistical process control (SPC) is a tool that will help you understand the variation in any process with the aim of reducing it and then as a result, making the process more predictable and reliable. Here is how it looks like: In this post, you will learn:
It is particularly important to understand the meaning of variation and differentiate it from variety. I think you can tell the meaning of variation from the questions in the above home-office example but let me differentiate it from variety. Think of variety as a good thing or the joy of life. For example, we enjoy the variety of food or sceneries when we visit a city. In contrast, variation is not joyful. It is bad quality. Imagine an auto manufacturer produces hundreds of cars every day where every car has five to ten defects. This factory does not know how to minimize variation. In this post, we are interested about variation. Variation is the difference between the standards or objectives that were defined by companies to satisfy the specifications of clients, audits, regulations, owners or other stakeholders and the real/actual data. In reality, everything varies to some extent; no two tires weigh exactly the same and 1 + 1 does not equal 2 😐google it if you don’t believe me. Companies that understand quality focus on keeping variation at its lowest level or at least to an acceptable level. A process that is stable and in control will produce a predictable process which means whatever variation the process has is a common cause variation and nothing can be done about it. On the other hand, there is something called ‘special cause variation’ which happens when the process shows unexpected variation resulting from unknown factors. This type of variation is worth looking at and investigated by management. If anything to remember of what I have rambled about above is that there are two types of variations:
Process Behavior Chart was created to distinguish between these two types of variation. That is why this chart is an essential tool for improvement. Let’s explain this more. There are three categories where PBC can help you: 1.To identify:
2.To predict: In stable or predictable processes, you can predict the range of values within which future measurements will fall if the conditions or ‘systems’ don’t change. 3.To assess the impact of improvements: PBC can be used to test the impact of an improvement action you implemented to a process. You can examine if the change made any significant difference to the process: good or bad. When testing though you should start on a small scale. Using PBC this way and while analyzing and before actually implement a change project, will provide you some evidence on which either to implement the full change or back to investigate more. Follow up questions I hope that I was successful in introducing you to PBC and its benefits. That said, I am sure you still have questions like: How to build a process behavior chart? How to interpret the chart? Is there an example? How to calculate limits of routine variation? Do you have other questions you would like me to answer? You can consider this post as an introduction. I will answer these questions in coming posts. Stay tuned 🤞
0 Comments
|
|


