|
By: Sinan AlKhatib What is web analytics? The Digital Analytics Association (DAA) defines web analytics as the measurement, collection, analysis and reporting of Internet data for the purposes of understanding and optimizing web usage. Many analysts think that if they can tell the number of visitors to a certain website for a certain period of time, this is called web analytics. Well, that’s not accurate. Measuring the number of visitors to a website or being able to tell how many users successfully made a purchase is called website statistics. Web analytics goes deeper than that, and involves more metrics. Web analytics attempts to explore the reasons why certain actions on a website happen the way they do, and attempts to spot patterns. The goal of website statistics is to report some facts about things that occur on a website. On the other hand, the goal of web analytics is to help make improvements to websites and to online marketing. That said, you can’t perform web analytics without the help of website statistics. What is Google Analytics? Google Analytics is a free web analytics tool for tracking and reporting website traffic. A subscription-based service, Google Analytics 360, is also available, but it’s very expensive. These tools can help users to review online campaigns by tracking landing page performance. Users can also study the bounce rate, which, if high, indicates that something should be changed to optimize page performance. Writing about all of the features of Google Analytics would take a long time, and I would rather focus on letting you know why advanced users may need to extract data from this awesome tool to a different format. Why might you need to extract data from Google Analytics? As mentioned above, tracking your website or application in Google Analytics is useful. You can utilize reports in a user-friendly interface, assuming that reports are all you need. To be honest, however, this reporting interface can end up being annoying if you want to use the raw data from the reports. And no, Google Analytics doesn’t allow you to export raw data. To be honest, it has its limitations. In this post, we will examine how to extract and exploit data from Google Analytics by using R, the famous data science programming tool. Procedure for extracting data by using R An API, or an Application Programming Interface, is a way for developers to access applications. An API will mainly help you perform data queries in both read and write modes. The API will also allow you to pull any dimensions or metrics in Google Analytics. To explore the list of dimensions and metrics and their descriptions, you can visit the Google Analytics developers’ site here: https://developers.google.com/analytics/devguides/reporting/core/dimsmets Why R? R provides a lot of possibilities that will definitely be needed for the digital analytics of the future:
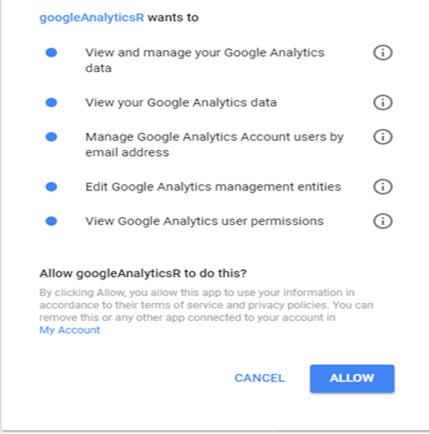
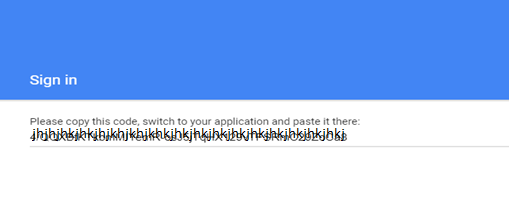
Step 1: Authorize the connection between R and Google Analytics Before we start, we have to install and use a package that is necessary to connect to Google Analytics data. The package is called “googleAnalyticsR”. If you want to know more about this package, you can click on the package name above. To install the package, run this code in R: Then, call the package by running the following command: The next command will direct us to a webpage for authorizing R to access Google Analytics. Note that you should be logged into the Google Analytics account that is registered for your website: Click “Allow” to authorize the connection. An authorization code, similar to the following, will be generated. Copy the code and paste it in R when you are prompted to enter the authorization code. Step 2: Get the view ID for Google Analytics As a Google Analytics consultant or administrator, you may have access to one or more views in the same Google Analytics login. It’s important that you select the right view before you start your analysis and extraction. The following code will allow you to view all of your account’s views. Each view will have its own unique “viewId”: Once you find the right viewId, copy it and store it in a new variable in R, like this: Step 3: Run your query You need to decide the range of dates for the data you want to pull from Google Analytics. There are many ways to do so. For simplicity’s sake, you can select the date in advance. See the following example: Or, if you’re like me, I like to input the dates myself. To do so, you need to follow this date format: YYYY-MM-DD. Now, let’s enter our first query: To view your data, simply run Q1. A table with your data will appear, in a format similar to the following:
Now, let’s run a session query: The query will return a table similar to this:
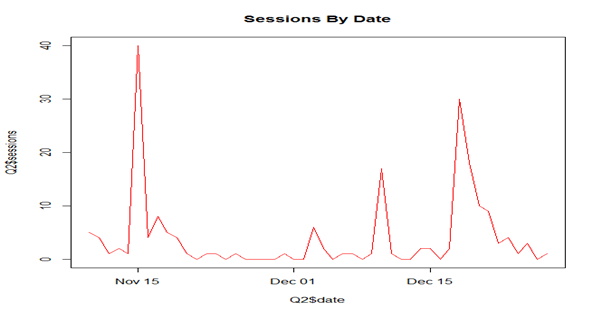
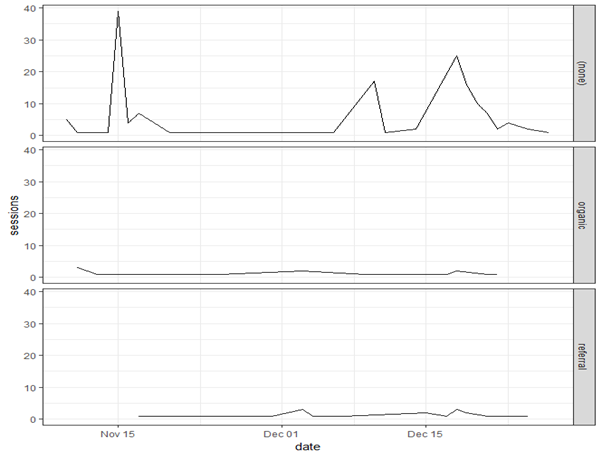
Step 4: Perform some exploratory analysis In this post, I won’t go into deep analysis. I will, however, show you couple of charts. When you have raw data, you can start to conduct your own analysis. Let’s look at the number of sessions opened by date: A line graph will be generated as shown below: Let’s take a look at another example. In this example, we want to examine the medium, or the type of website traffic, for the sessions by date. You can use this sample code: The resulting graph is faceted, because there are multiple media. What have we learned?
By now, I hope you are able to appreciate the value of using R to connect to Google Analytics and that you have realized the powerful things you can do by analysing any type of website. That said, we have only just scratched the surface in this post. We learned how to connect to Google Analytics by using its API and how to select the right viewId for the targeted Google Analytics’ view, and we have also learned how to run some simple commands in order to visualize some of the data we have extracted. Mastering these skills is essential if you want to continue with your analysis. The trick is to know exactly what your goal is, and then to fetch the right sections and extract them. The amount of things you can do is limitless; it will all depend on you and your imagination.
0 Comments
|
|


