|
By: Sinan AlKhatib  Introduction Let’s start with a story: Once upon a time, there was a big grocery store located in an undisclosed area. The owners of this store were smart, so their business decisions were mostly data-driven. The owners wanted to mine customers’ transaction data to understand trends in their customers’ purchases. The results of this data mining showed many correlations, but there was one correlation that stood out. The results of the analysis showed that young fathers who bought diapers would also buy beer at the same time. The owners were shocked. They didn’t see that coming, and never would have predicted such a result. There are many possible causes for this correlation, but I see it this way: As these young fathers walk around the store, they know they won’t be able to get out of the house to join their friends at the bar. Nothing can stop them from drinking beer at home, though. Now, what did the owners do about this finding? They moved the beer next to the diapers. Guess what? Sales of both beer and diapers went up. Some say that they increased by about 35%. To be honest, this is not a true story, but it is true that you can make significant findings by mining your customers’ data. Today, successful companies are applying advance predictive analytics to their big data to improve business performance. Customer, product, and marketing analytics allow companies to discover useful insights and explore new opportunities to improve their revenue. Market basket analysis, also called affinity analysis or association rule, is one of these powerful tools that is used to determine associations between items or events. Market Basket Analysis https://www.kdnuggets.com/2016/04/association-rules-apriori-algorithm-tutorial.html Market Basket Analysis is a major technique used by retailers that is based upon the idea that customers who buy a certain group of products are either likely or unlikely to buy other groups of products. This technique looks for combinations of products that are frequently purchased together. As we saw in the above story, it is a technique for identifying relationships between the products that people buy. To perform market basket analysis, we need a data set of transactions. Each transaction consists of a group of products that were bought together. Let’s say that I visited a supermarket and bought yogurt, milk, pens, cheese, and paper. These products were bought in a single transaction. The transactions are then gathered and analyzed to identify rules of association. To use the example in the previous paragraph, one rule might be that if a customer buys milk and yogurt, the same customer might also be interested in buying cheese. The question is now, how can we determine the strength of the association? To answer this question, we need to consider three metrics:
Now, let’s move on to the serious stuff and see the market basket analysis model in action. Market Basket Analysis using R The data setI will be using a data set that is available at this link http://archive.ics.uci.edu/ml/machine-learning-databases/00352/ . This data set comes from the UCI Machine Learning repository. It contains transactions occurring between December 1, 2010 and December 9, 2011 for a UK-based and registered non-store online retailer. The company mainly sells unique all-occasion gifts. This data set contains the following variables:
Prepare the dataTo perform the market basket analysis, the data set should be shaped in a certain way. We will see the final format later, but first let’s clean up our data set.
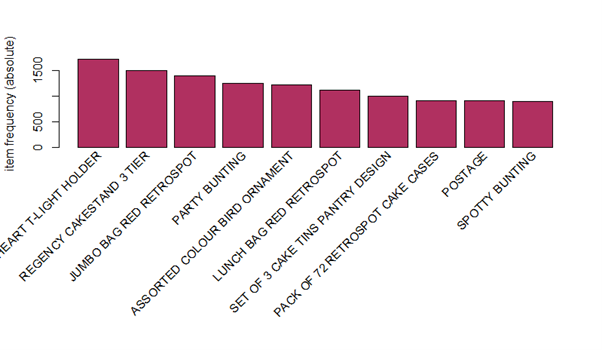
Now we are ready to change the format of the data set to start the basket analysis. Association Rules To be able to start our mining algorithm, we must transform the data from the data frame format to a transaction format, where all items that were bought together are listed together in one row. We will first sort the data in ascending order by CustomerID, by using the order function. Then, we will run the ddply function to transform the data and split it into parts based on one or more factors (in this case, CustomerID and Date), and then acquire the results as a newly formatted data frame. The items will be separated by a comma. To reach our final format, we will remove the CustomerID and Date variables, and write, or save, our new data set in the CSV file format: By now, the data should be ready for analysis. First, let’s take a look at the data frame: 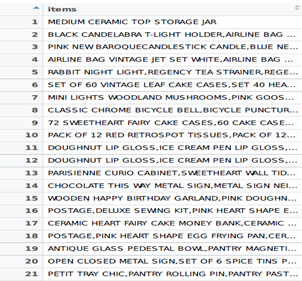 As we can see, the items that were bought together are listed in one row. To get a better sense of the data, we will call the summary command for the data: 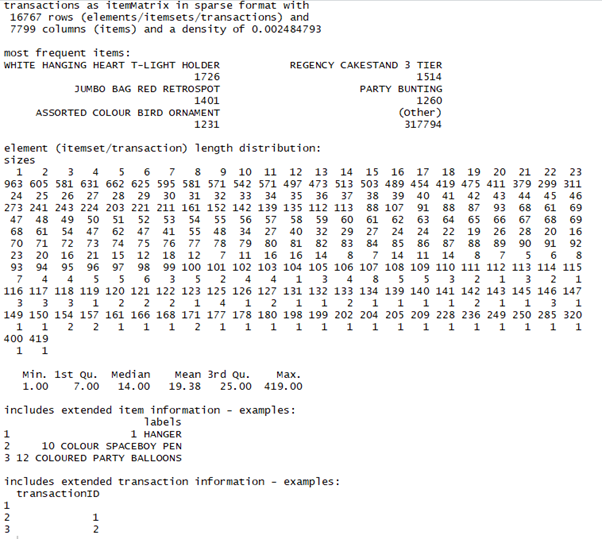 There are 16,767 transactions and 7,799 items. Some useful information can be obtained from this summary:
 The final step is to generate the rules with the corresponding support and confidence using the Apriori Algorithm in Arules library: 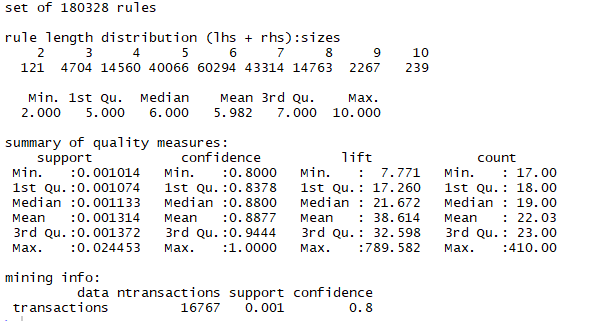 The following information can be obtained from the summary:
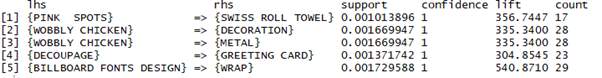 As an example to explain the results, note that 100% of the customers who bought {Pink Spots} also bought {Swiss Roll Towel}. But what if we examine the rules by the lift? 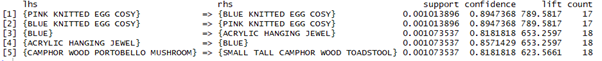 We can also subset the rules by any item: 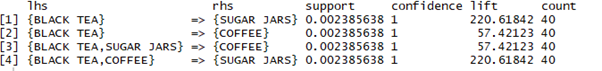 Finally, let’s plot the top 5 rules: 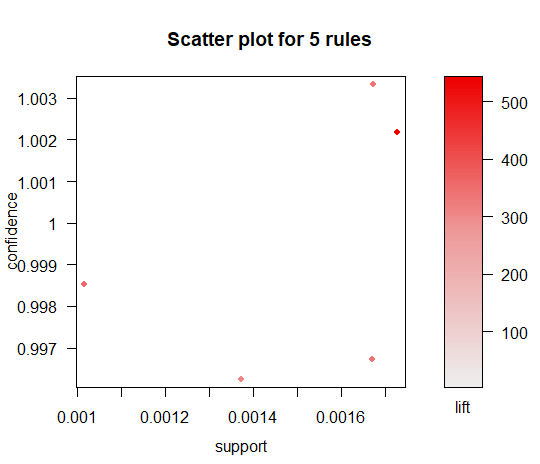 Conclusion
Market basket analysis is an unsupervised machine learning method that can be used by retailers to understand their customers’ purchase patterns. We used Apriori Algorithm in this analysis, where we examined three main metrics: support, confidence and lift. Support measures the frequency an item appears in a data set, confidence measures the predictive power of accuracy, and lift measures the likelihood of an item to be purchased relative to its typical purchase rate. As we have seen, running the market basket analysis was not that difficult, and the results were easy to understand. Next, we will do the same analysis but with the help of Python instead of R. As usual, if you have any questions, or if you want to learn more about market basket analysis, you can always CONTACT me.
0 Comments
|