|
By: Sinan AlKhatib

What is RFM? Two years ago, I was talking with a friend of mine about historic data that companies use to enhance their understanding of their customers. My friend told me about a cool model that is used to classify customers. The thing that really got my attention was that this model looks at different aspects in order to evaluate each customer. Usually, companies tend to label customers based on financial aspects, but this model takes things further. This model is called RFM, which stands for Recency, Frequency and Monetary value. RFM is a marketing technique that is used to evaluate the behavior of a company’s customers. For example, it can be used to evaluate how recently a customer has purchased a product or a service (recency), how many times the customer has made a purchase since a certain date (frequency) and how much the customer has spent in a given a period of time (monetary). Benefits Know your customers Rewarding loyal customers is an important marketing strategy for any company, regardless of the business model it follows. RFM helps companies to know their loyal customers, who are the their customers that are not happy with their services and products, and their former customers who have already left them. Imagine if this valuable information about your customers could be provided to you. What techniques could you then use to increase your retention rate and reduce your turnover rate? Boost your sales Companies should understand that their customers have different needs and requirements, and therefore respond differently to the company’s marketing campaigns. By looking at your customers via the three key aspects of the RFM analysis model, you can significantly improve your marketing techniques and target your campaigns more accurately to those customers’ desires and needs, which ultimately will boost your response rate and sales. Do NOT lose your customers With RFM analysis, you can classify your customers into a number of categories. The number of categories depends on the nature of the business and the instincts of the analyst. Regardless of the number of categories you use, you should be able to understand which customers represent a potential loss of business, which customers are regular customers, and which customers have already left. You should then take different actions for each of these categories, and you should set your priorities. For example, you can send personalized e-mails to customers to who are at risk of leaving in order to reconnect with them. 80/20 Rule The 80/20 rule, also known as the Pareto Principle, is a rule of thumb that claims that 80% of the results can be attributed to 20% of the causes for a certain event. Usually, a business uses this method to point out that 80% of the revenue is generated by 20% of its total customers. This approach helps the decision makers to focus on the most important factors that affect their resources. Here is an example of the Pareto Principle in which 20% of customers are responsible for 80% of the revenue: 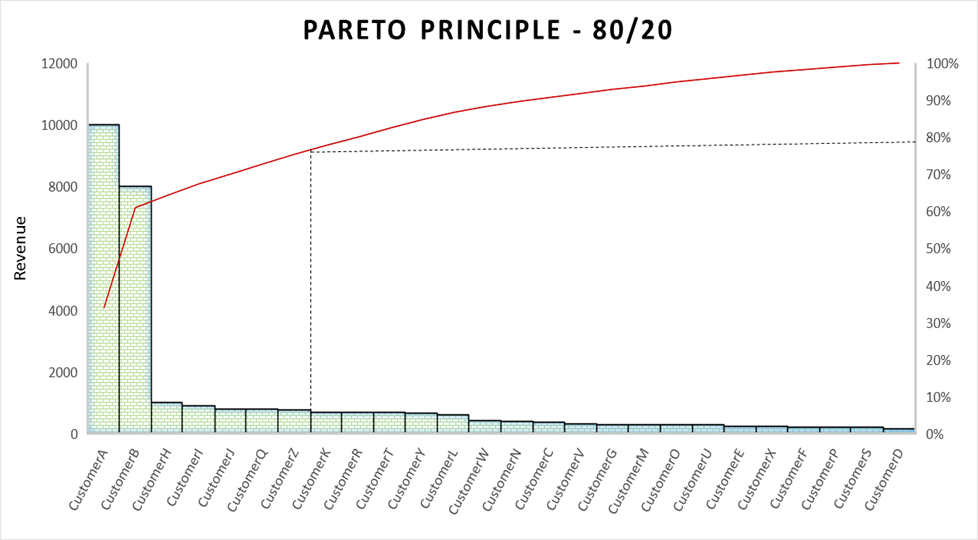
If a company can identify its top spenders, it can market to them in order to retain existing customers or acquire customers with similar profiles. As we can see, the 80/20 rule is extremely useful and can be used to quickly gain insights about our customers. The drawback, compared to RFM, is that it only looks at the frequency of spending, and doesn’t deal with the recency.
Still, this rule is widely used and it can be very useful for many companies. I actually recommend applying this first, and then performing an RFM analysis. How does RFM work? To classify your customers by using RFM, divide the customers into four equal groups, or quartiles, based on the distribution of recency, frequency, and monetary values. This will result in 64 different customer segments across the three variables. Some analysts divide customers into 5 different groups, but this approach can be more difficult. To illustrate this further, let’s take a look at the groups.
A customer who made a recent purchase will be within the first quartile in R (R=1). A customer who purchased the smallest quantity will be in quartile 4 in F (F=4) and so on. For example, if a customer’s score is 444 (R=4, F=4, M=4), this means that this customer has not made a purchase for a very long time, purchased maybe once, and spent less than most of the other customers.
The following is an example of key RFM segments with recommended marketing strategies:
Example
I have recently conducted an RFM analysis, basically for fun, for an online retail store. For this analysis I used R and Python and demonstrated the results using Tableau. I have used R to clean the data, so the resulting dataset is as follows:
Then I used Jupyter to run Python commands to build the RFM segments. This resulted in the following dataset:
To visualize the data, I uploaded the dataset into Tableau and built the following dashboard:
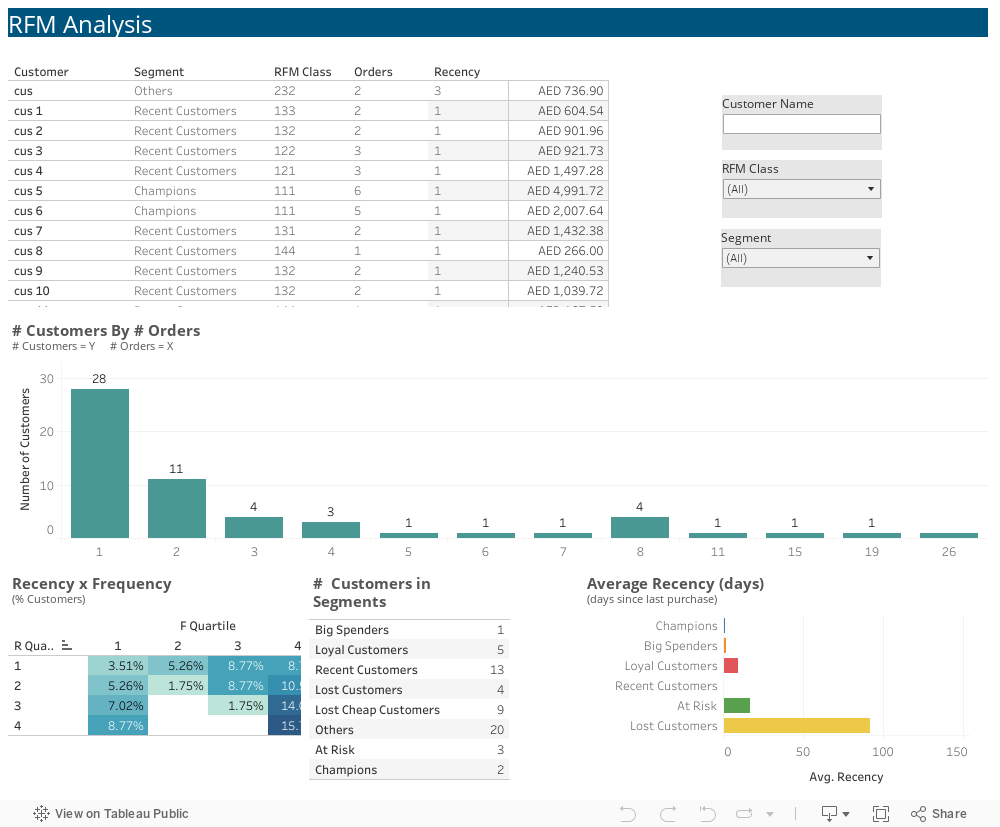
Although this data is not real, it can showcase the usefulness of applying RFM analysis to categorize your customers. This dashboard can provide you with a quick overview of your customers. For example, if you are interested in knowing which customers might leave your business, you can use filters to select customers that are at risk of leaving. Then you can follow the marketing actions list that I provided earlier. Please feel free to play with the dashboard to see how these techniques can work for you.
Advantages and Disadvantages of RFM Finally, let’s summarize the advantages of the RFM analysis and list some of its limitations. Advantages
Disadvantages
1 Comment
|